

MOS Score: Measure & Improve Voice Call Quality

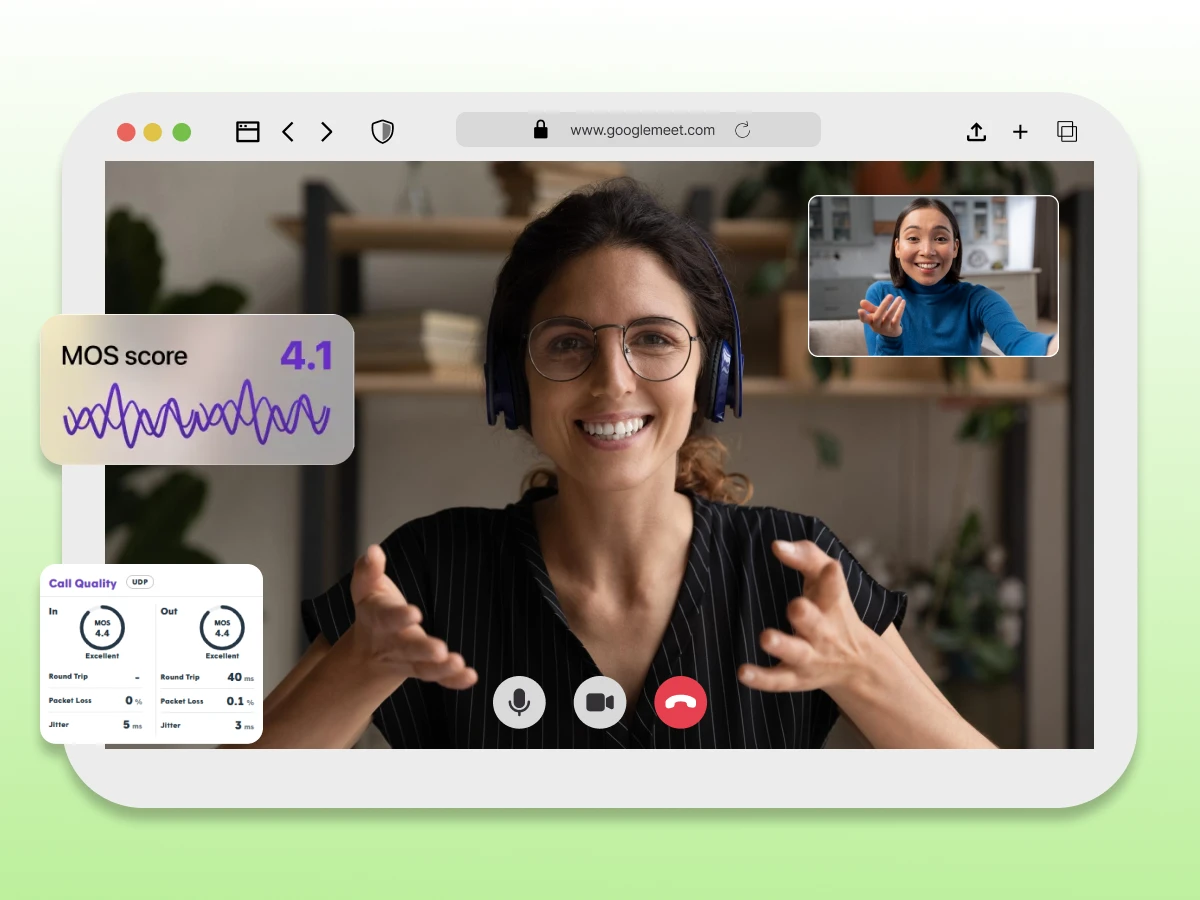
Have you ever been on a call where the audio cuts out or the voice on the other end sounds robotic?
It’s frustrating, and for businesses, it can be a disaster. To keep conversations clear, engineers need a reliable way to measure how good or bad a connection actually is.
That’s where the Mean Opinion Score (MOS) comes in.
It’s the industry standard for measuring call quality and ensuring your phone system performs when it matters most.
Let’s explore MOS in detail.
A Mean Opinion Score (MOS) is a numerical rating used to measure the perceived quality of voice calls and video meetings.
Ranging on a scale from 1 (unacceptable) to 5 (excellent), a MOS score gives IT teams a quick way to benchmark communication quality.
While originally based on subjective human feedback, modern MOS values are often calculated using software algorithms that analyze network health.
It specifically examines packet loss, jitter, and latency to predict the human experience without requiring actual listeners for every call.
To interpret MOS correctly, you first need to understand how the scoring scale works.
To really get a grasp on voice quality, you have to look at the numbers.
The telecom industry relies on a standard 1 to 5 rating scale (technically known as an absolute category rating). It is actually pretty intuitive; think of it like giving a star rating to your Uber driver or a restaurant.
Here is what those numbers actually feel like when you are on a call:
| MOS Score | Rating | What It Sounds Like in Real Life |
|---|---|---|
| 5 | Excellent | This is like talking to someone sitting right next to you in a quiet room. Honestly, a perfect 5.0 on digital voice calls is theoretical because the software almost always compresses the audio slightly. |
| 4 | Good | This is the sweet spot and the target for most businesses. The audio quality is clear, and you don’t have to struggle to hear anything. Most reliable phone systems live in this range. |
| 3 | Fair | The call is usable but requires concentration. You may notice slight distortion, brief delays, or occasional clipping during the conversation. |
| 2 | Poor | You get choppy audio with missing words and frequent interruptions. Conversations become frustrating and often require repetition. |
| 1 | Bad | This is unacceptable. It’s either total silence or harsh noise. You usually just have to hang up. |
Basically, if your MOS value drops below 3.6, your team usually starts filing support tickets.
In practice, most businesses aim to stay comfortably above the “Fair” range to avoid noticeable call quality issues. The score of 4.0 to 4.5 is considered the ideal.
Now that the scale is clear, the next question is how this score is actually calculated.
You might wonder how a computer puts a number on something as personal as “how good does this sound?” It turns out, there are two very different ways to get that number: asking real people or asking a machine.
Originally, getting a MOS rating was a purely manual process, literally a subjective experiment. Companies would gather a panel of listeners or observers in a quiet, controlled room.
These people would listen to various audio clips processed through different connection types and give their individual ratings based on a 1-5 scale.
This method is still considered the most accurate representation of the human experience because it measures genuine perceived quality.
However, it has a massive downside: it is slow, expensive, and impossible to do in real-time. You can’t have a guy named Steve listening to every one of your customer support calls just to grade them.
To overcome these limitations, objective methods were introduced.
To solve the speed problem, engineers developed objective measurement methods. Instead of using human ears, MOS is calculated using complex algorithms that analyze the network data itself.
Software looks at technical factors like how much audio data is arriving late or getting lost. Then, using standards like PESQ (Perceptual Evaluation of Speech Quality) or POLQA, the system predicts what a human would likely rate that call.
This allows IT teams to monitor business communication quality automatically across thousands of voice calls without anyone needing to listen in.
Once MOS is calculated, several technical factors determine whether the score stays high or drops.
Communication Fundamentals
Sep 1, 2025
Read More
When call quality drops, it is rarely just bad luck. Voice calls are divided into thousands of small digital fragments, which are transmitted and then patched together in milliseconds all over the internet.
The following are the key things that come in the way:
Once packet loss reaches 1 to 2 %, it may not affect Quality of Experience (QoE), but exceeding 5% makes conversations unintelligible. When MOS drops, checking these factors systematically helps identify the root cause faster.
If your MOS value drops, it’s a sign that your voice calls or video meetings aren’t delivering the expected quality of experience.
Here’s a user-friendly guide to quickly identify and fix common issues affecting audio and video quality.
While MOS is powerful, it’s not the only metric used to evaluate call quality. Discover how call routing improves communications quality. *Industry standards recommend one-way latency below 150ms to maintain natural, conversational VoIP call quality.
MOS provides a high-level of perceived quality, but other metrics explain why quality changes.
| Metric | What It Measures | Scale/Rating | Key Focus | When to Use |
|---|---|---|---|---|
| MOS (Mean Opinion Score) | Perceived voice and video quality | 1–5 (Absolute category/rating scale) | Human experience; overall audio and video quality | Quick assessment of call quality for voice calls and video meetings. |
| R-Factor | Network performance affecting call quality | 0–100 | Technical factors (packet loss, jitter, latency) | Convert to MOS for human-perceived quality and monitor network health. |
| Latency | Delay in packet delivery | Milliseconds (ms) | Network responsiveness | Identify talk-over problems or delays in voice calls and video sessions. |
| Jitter | Variation in packet arrival time | Milliseconds (ms) | Stability of audio/video streams | Detect choppy audio or poor video quality. |
| Packet Loss | Missing data packets during transmission | Percentage (%) | Reliability of the network | Diagnose audio dropouts or degraded voice and video quality. |
| Subjective Experiment / Individual Ratings | Human listeners’ evaluation of audio | 1–5 | Human perception of session quality | Benchmark MOS accuracy, though it is expensive and not suitable for real-time monitoring. |
| Objective Measurement Methods | Algorithm-based MOS calculation | 1–5 | Predicted perceived quality | Monitor MOS automatically in real time across thousands of voice and video sessions. |
Using MOS alongside technical metrics gives a clearer picture of both user experience and network health. To act on these insights, MOS needs to be measured continuously and in real time.
Waiting for a user to complain about voice calls is the worst way to monitor quality. To stay ahead of issues, IT teams need to measure MOS values in real time. Here is the step-by-step process for getting real-time data.
You generally have two options here. Passive monitoring watches actual, live voice calls flowing through your network to spot problems as they occur.
Active monitoring, on the other hand, injects synthetic traffic, basically “fake” calls, into the network to stress-test the connection.
Active monitoring is great for troubleshooting when no one is on the phone, while passive gives you real human experience data.
To calculate a score without asking people for their opinion, your software needs raw data. It tracks latency (delay), jitter (variance), and packet loss. It also checks which audio codecs are being used, as a high-compression codec naturally lowers the maximum possible score.
Once the data is collected, a mathematical formula takes over. Most systems first calculate the R-factor (a transmission rating from 0 to 100 based on the E-model). The software then uses a standard conversion table to translate that R-factor into the familiar 1-5 MOS value.
This allows you to turn technical network statistics into a simple quality grade.
You don’t do this math with a calculator. You use Network Performance Monitors (NPMs) or SD-WAN solutions that include these features.
Many modern tools and even open-source stacks can automatically display the MOS score on your dashboard, alerting you the moment audio quality begins to drop.
Therefore, real-time measurement turns raw network data into actionable quality insights.
Even with monitoring in place, certain issues consistently cause MOS scores to drop.
Recurring MOS issues usually stem from technical limitations, configuration choices, or measurement constraints.
Network instability can still impact MOS, with factors like jitter, latency, and packet loss being key contributors. A jitter level >150ms is considered unacceptable as it degrades the call quality completely. The ideal level is below 30 ms.
Regularly monitor your network and bandwidth to maintain optimal communications quality.
Poor Codec Selection: Heavy compression can limit audio quality, lowering MOS even on a strong network.
Echo: Signal leakage between the mic and the speaker can be very distracting.
Packetization Delay: Slow processing of audio into packets adds lag to calls and video sessions.
Low-quality Headsets/Microphones: No network tweaks can fix a bad source signal.
Unstable Connections: Spotty Wi-Fi or overloaded networks can reduce session quality.
Resource-intensive Software: PCs or phones running at full capacity may not process audio or video fast enough.
Subjectivity/Bias: Individual listener preferences can skew mean opinion scores in a subjective experiment.
Average Issues: A call may be perfect most of the time, but a brief dropout can be hidden in the average MOS.
Perfect 5.0 is Unrealistic: Due to compression and digital transmission, most systems rarely exceed 4.5.
Recognizing these common problems helps teams respond faster and more accurately.
The good news is that most MOS issues can be fixed with targeted improvements.
Knowing your MOS score is low is one thing; fixing it is another. Since voice calls and video meetings happen in real-time, they are incredibly sensitive to network hiccups.
To get your Mean Opinion Score back into the “Good” range (4.0+), you need to tackle the problem from three angles: the network, the hardware, and the software settings.
Think of your network like a highway. If everyone is driving in the same lane, traffic jams happen.
Sometimes the issue isn’t the internet line, it’s the gear at the end of it.
Tweak the software settings to match your available bandwidth.
You can’t fix what you don’t watch.
When you apply these practices together, these improvements help maintain a consistently high MOS across voice calls and video meetings.
Ultimately, a MOS score isn’t just technical data; it is the heartbeat of your business communication.
If your voice calls are choppy or dropping out, you risk frustrating clients and losing revenue. By actively monitoring latency and packet loss, you can stop bad audio quality before it starts.
Don’t settle for “good though”; keep your communication quality sharp so every conversation counts.
Mean Opinion Score (MOS) is a numerical rating used to measure the perceived quality of voice calls and video meetings. It indicates how clear or distorted the audio sounds from the user’s perspective.
You can measure MOS through subjective testing, where people rate call quality, or with objective measurement methods that use software algorithms to estimate the listening experience automatically.
The MOS scale ranges from 1 to 5. A score of 1 represents poor call quality that makes communication nearly impossible, while a score of 5 indicates excellent quality comparable to a face-to-face conversation.
For most business communications, a MOS score between 3.6 and 4.4 is considered acceptable. Scores below 3.5 usually indicate noticeable audio degradation that can negatively affect conversations.
