

What is Churn Rate? How to Calculate and Reduce It

Every business loses some customers. The real question is how many and why. Churn rate gives you a number to start with. It shows how fast your customer base shrinks and what that costs you.
Want to know how to calculate it and bring the number down? Here’s a simple, practical way to do both, from the basic formula to the steps that actually help you keep more customers.
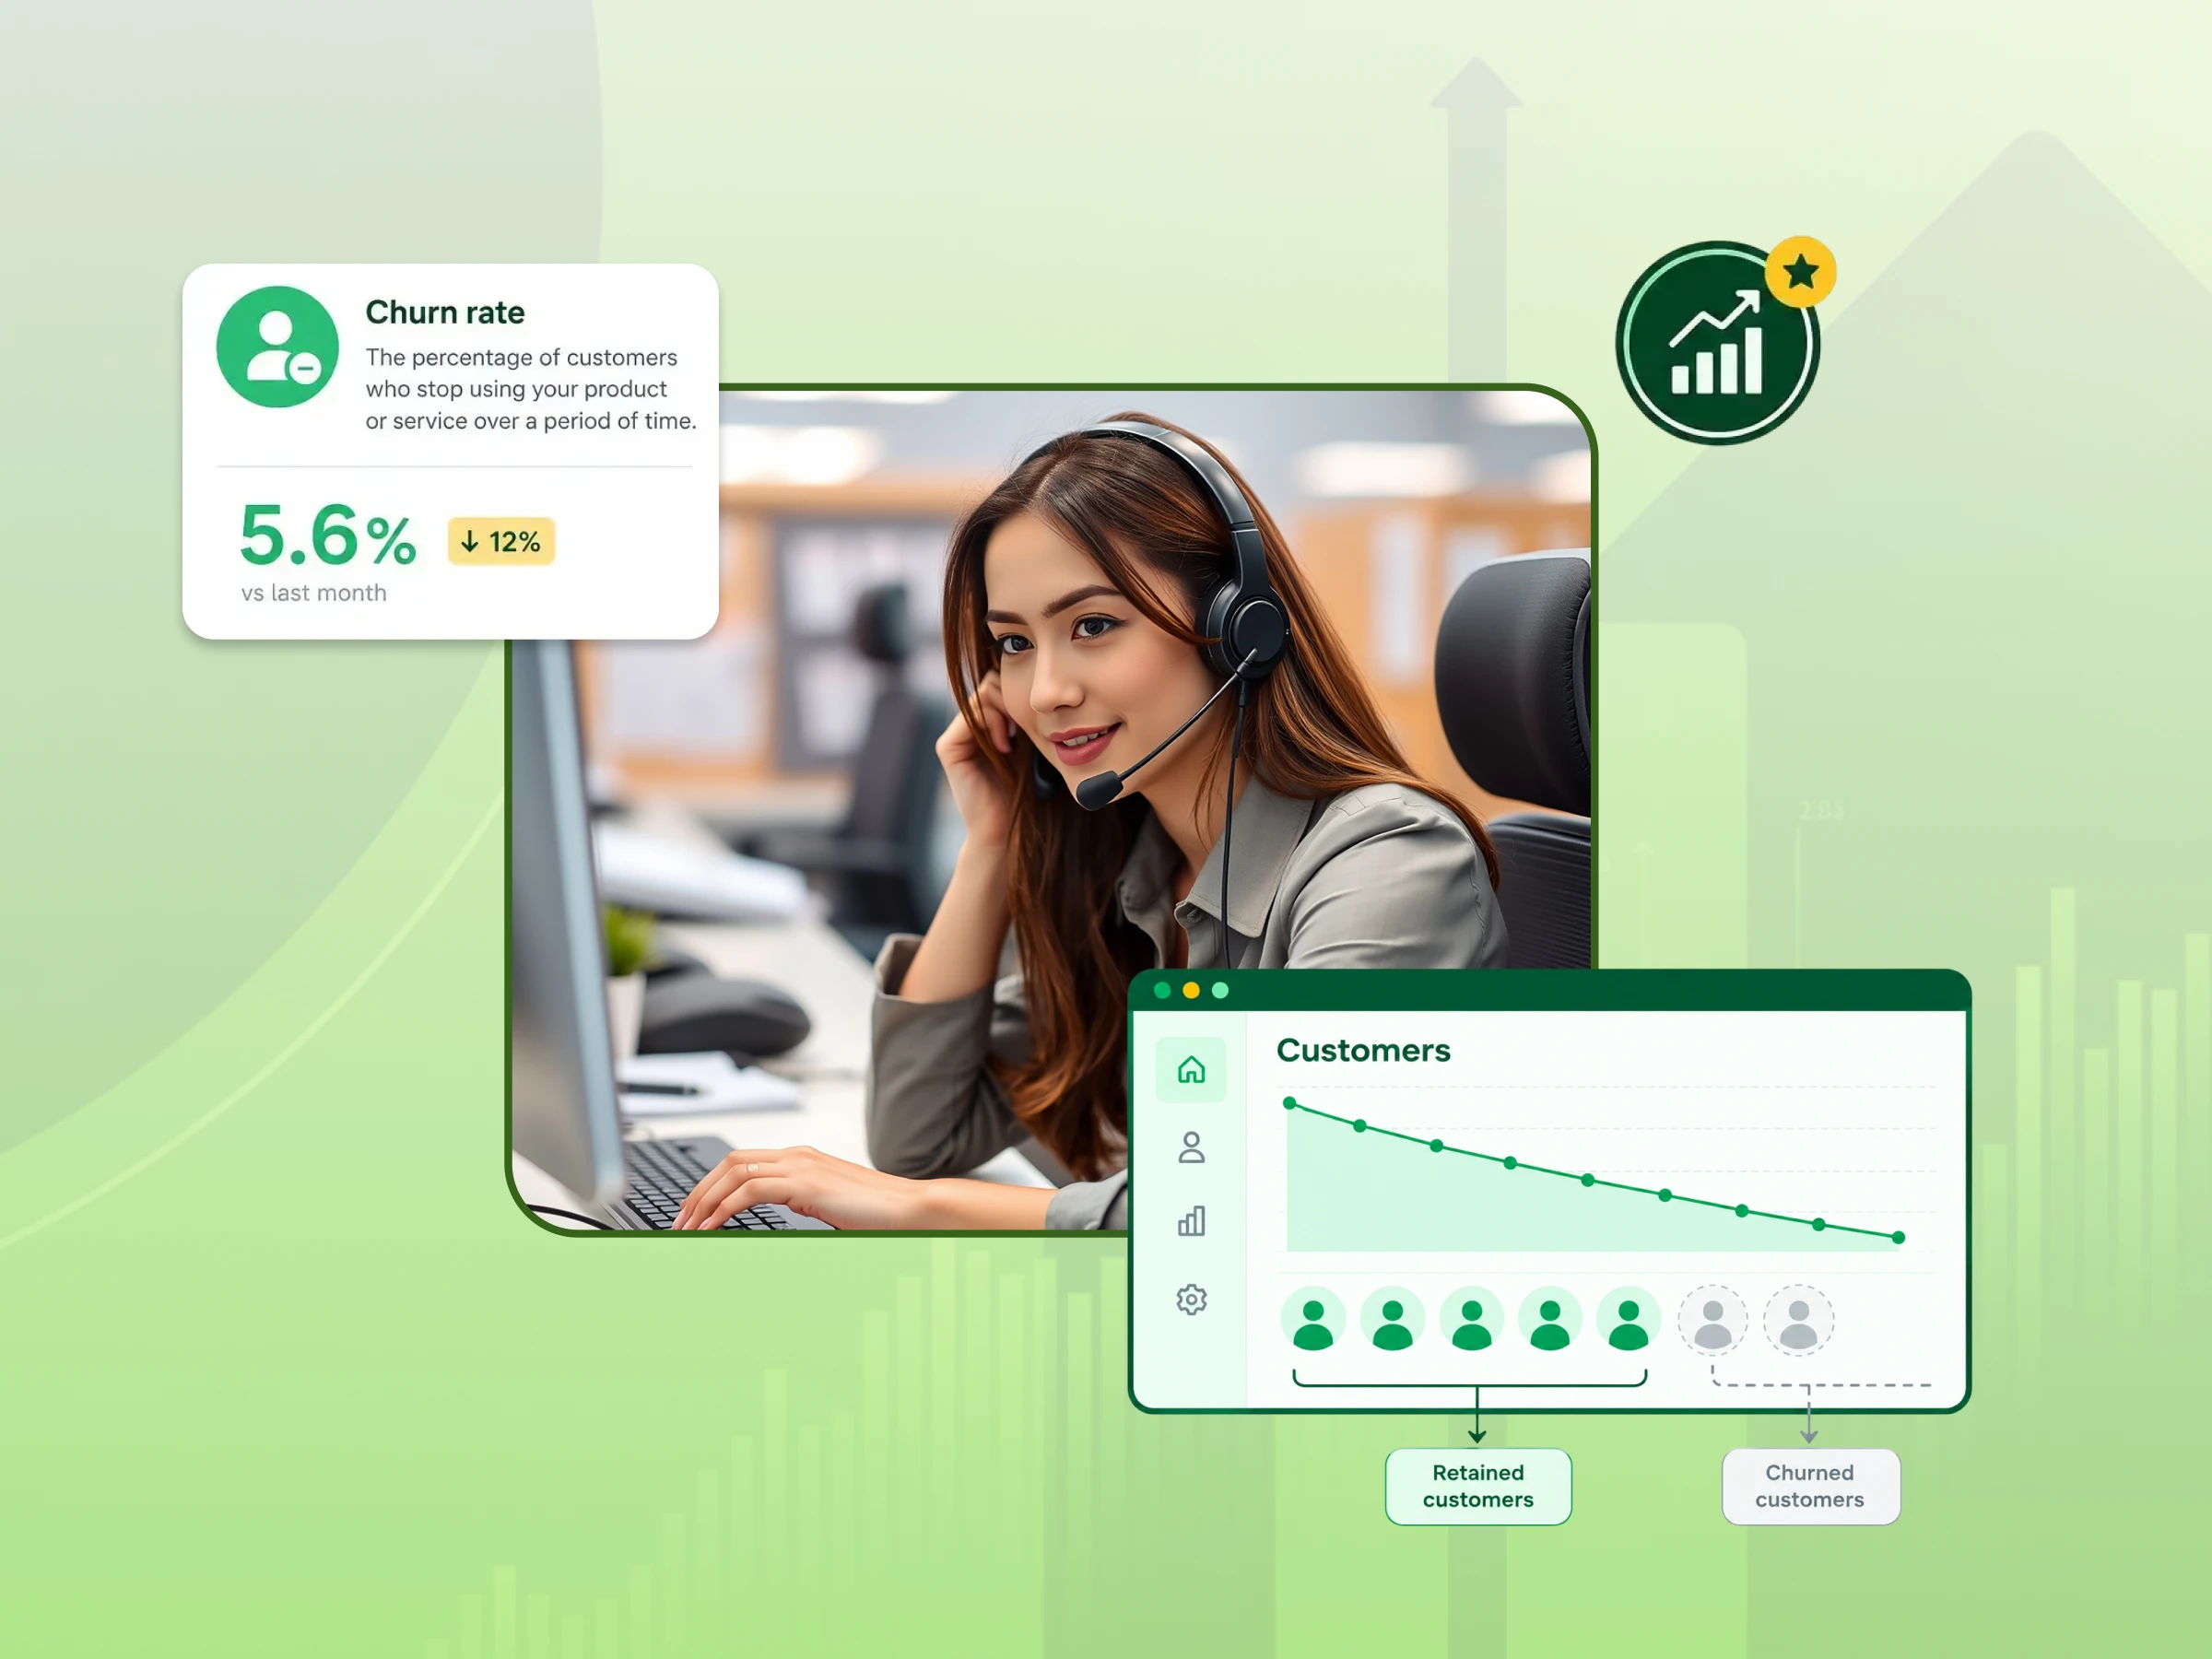
Churn rate is the percentage of customers who stop doing business with a company during a set period. Subscription businesses watch it closely. Their customers can cancel or skip a renewal at any time. Picture a streaming service that starts April with 1,000 subscribers. By month’s end, 40 have left. That loss is churn.
There are three practical reasons why businesses monitor churn rate. Other groups refer to it as customer attrition or customer turnover.
It measures the effectiveness of the customer retention efforts and is a key performance indicator to assess how well you retain your existing customers.
Every lost customer will bring along recurring revenue over time, which will impede the growth of revenue.
Customer experience: If you’re seeing a sudden increase in churn, you’ll need to ask yourself why; perhaps it is the product, the price, or the support.
Churn is associated with, but different from, retention. Customer loss is measured in terms of churn rate. Retention is the number of customers who remain. They reflect one another when the same definition is used and the same time frame. A business that combines the two can find itself with numbers that don’t add up.
The math is simple. The hard part is agreeing on definitions. Start with the formula.
Customer Churn Rate = (Customers Lost / Customers at Start of Period) × 100
This is the basic churn rate formula. It works for most businesses. Still, you must decide what counts as a lost customer. Then you apply that rule every time.
The formula has three parts:
Subscription teams need a few extra rules. Do you count only paying customers? How do you treat cancellations? What happens when a customer comes back? Write down your answers. Then keep them fixed.
In plain words, you ask one question. Out of your total customers on day one, how many customers are left in the given period? Those churned customers are your lost customers. The number of customers who joined later does not change that count.
Take a monthly example.
This business has a 5% customer churn rate for the month. Anyone measuring churn monthly gets a monthly churn rate the same way.
Four points keep your numbers honest:
Platforms differ. Check how your tool defines churn before you compare results.
Not every loss looks the same. Subscription churn comes in a few forms. Four terms cover most situations.
Customer churn counts accounts. Each customer counts as one no matter what they pay.
It tracks recurring revenue lost when customers cancel or downgrade. The revenue churn rate matters most to businesses that live on monthly recurring revenue. Many SaaS companies fall into that group.
Revenue churn comes in two versions.
This happens when customers choose to cancel or skip a renewal. Price, low value, and changing needs are common reasons.
Involuntary churn happens when a billing problem ends the subscription. Payment failures are the usual trigger. The customer never chose to leave.
Notice what these terms do. Voluntary and involuntary churn describe why someone left. Customer and revenue churn describe what you measure. You do not need to track every type. Choose the ones that fit your business model.
| Metric or type | What it measures | Why it matters |
|---|---|---|
| Customer churn | Customers lost | Tracks customer retention rate |
| Revenue churn | Recurring revenue lost | Shows the financial impact of losses |
| Voluntary churn | Deliberate cancellations | Helps identify product, value, or service concerns |
| Involuntary churn | Billing-related losses | Highlights payment and renewal issues |
There is no universal healthy churn rate. The right number depends on your industry, customer segment, pricing, and business model. Customer tenure and the measurement period matter too.
According to Stripe, what constitutes a good churn rate varies depending on several factors. For SaaS companies, a monthly churn rate of around 3%-7% is considered considerable.
Context changes everything. A low-cost monthly plan sees different cancellations than an annual enterprise contract. A new company churns differently from a mature one. Customer churn and revenue churn can also tell different stories about the same business.
Public numbers need the same care. You can find an industry average or a median annual churn rate in many reports. Yet average churn rates differ by source. Check the industry, company type, time period, and method first. Specialist subscription analytics research is the best place to look.
Then use benchmarks in four ways. Compare your current rate with your own history. Compare similar periods such as month over month or year over year. Compare similar companies or segments when reliable data exists. Compare cohorts when you have the data. The practical goal is simple. Watch your own trend and measure it against true peers.
Calculating churn is step one. Analysis tells you what to do about it.
Review churn monthly or quarterly and keep the periods consistent. Watch the churn trends. Suppose churn rises three months in a row. Look at what changed in those months. Do not assume the product or service is at fault. Pricing, seasonality, or a new campaign may play a part.
Break churn down by:
Segments help you identify patterns. Churn may sit in one group while the rest stay steady. Studying customer behavior inside that group points you to the next step.
Customer retention, recurring revenue, customer acquisition cost, and customer lifetime value each tell part of the story. Customer lifetime value estimates what the average customer brings in over time. None of these metrics replaces churn.
Form a hypothesis. Try an intervention. Measure the outcome. If newer customers churn more often, review onboarding and early customer support before you touch pricing.
Here is an illustrative scenario. It is not a real case study. A business notices that most customer cancellations happen in the first month. It reviews feedback from those customers. Many struggled to understand the service. The business tests a clearer onboarding process. Then it checks whether early churn changes.
| Pattern you see | What to investigate |
|---|---|
| Cancellations cluster in month one | Onboarding and early support |
| Churn is high on one plan | Pricing and plan fit |
| Churn follows one acquisition channel | Expectations set by that channel |
| Many failed charges | Billing and payment retries |
Customers leave for many reasons. Some are in your control. Others are not. Cancellation surveys and support conversations show which ones apply to you.
Failed payments also cause losses. That is involuntary churn. It is a billing mechanism and not a decision to leave.
Do not assume these are the five biggest causes everywhere. They are common starting points. Validate them with evidence. Customer feedback from surveys, cancellation forms, and support tickets shows what is really happening. Falling CSAT scores can flag trouble early. Product quality and price problems need product and pricing fixes. A better phone greeting cannot solve them.
Lower churn pays off in clear ways. Every kept customer extends customer lifetime and supports revenue predictability. New customers then add to growth and stop filling gaps. Group your actions and test them one at a time.
Good onboarding gets customers to their first win fast. Clear guides and short walkthroughs help. So does a quick answer when someone gets stuck. Collect the questions customers ask most. Then fix the root cause. Active customer engagement often signals a customer who sees value. High call center attrition among support agents can also increase customer churn, so keeping your team stable matters.
Be advised of the warning signs. This can range from using fewer products, unresolved complaints repeatedly, not renewing, and negative feedback. These are issues that need to be explored. They don’t show that a customer will walk away. Only use the data that is necessary and respect customer privacy. Then contact people early and inquire about their problem.
Tracking customer effort score can also reveal friction that leads to churn. Some SaaS businesses include loyalty programs in order to reward repeat customers. These assist when the product provides value already. Customer loyalty is built upon positive experiences initially.
Many customer retention strategies succeed or fail in the area of communication. Still, customers walk out the door if no one answers.
Practical steps include:
This is where your tools can help!
A business phone system with good call routing will ensure that callers are directed to your most appropriate team. An organized process facilitates staff’s ability to track inquiries and follow up. None of these are a standalone solution for reducing churn.
A cloud telephony system like Dialaxy can help in this aspect. The use of your team will determine the remainder.
Stripe’s recommendations also include the importance of tracking churn, listening to feedback, proactive customer service, onboarding, and segmentation.
Last but not least, measure everything that you change. Compare churn pre- and post-intervention. Maintain consistency in the definitions used. Use similar customer groups as much as possible.
Churn rate is simple to calculate and easy to misread. Define your terms. Pick one period. Track the trend. Then look for patterns and fix one cause at a time. Churn never reaches zero. A steady, honest process keeps it low. Clear communication helps you hear problems early.
Visit Dialaxy to see how they fit your retention work.
Churn measures customers lost during a period. Retention measures customers who remain. They mirror each other only when both metrics use compatible definitions and the same time period.
If you’re a subscription business, report it monthly, but quarterly or annual results might be appropriate for longer customer life cycles; just make sure you report on a similar timeframe, so that results will remain comparable.
Standard customer churn cannot be negative because it divides customers lost by starting customers. Net revenue churn can turn negative when expansion and reactivation revenue outweigh the revenue lost.
Lost accounts are equal to lost customers; lost recurring revenue is counted in revenue churn and is the same regardless of the size of the account in customer churn.
